How is the network doing right now?
Network dashboard
Station, device, and connector counts, device connectivity rate, and latest sessions—on the first panel page.
What you see and do in the Samasha panel—each capability framed by a question operations teams ask every day.
How is the network doing right now?
Station, device, and connector counts, device connectivity rate, and latest sessions—on the first panel page.
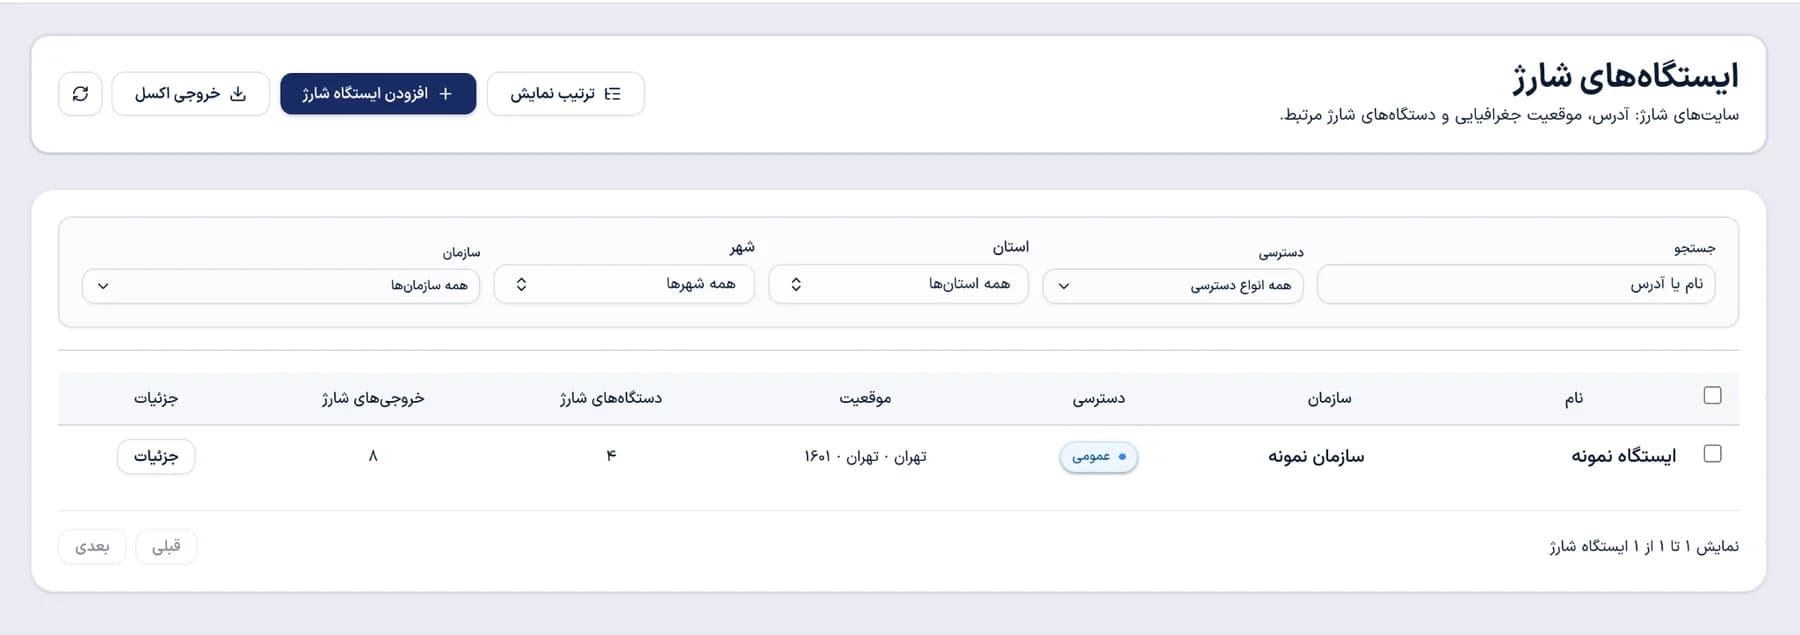
Which station, where, and which organization?
Register stations with address, province and city, organization, and access type—and find them with one search.
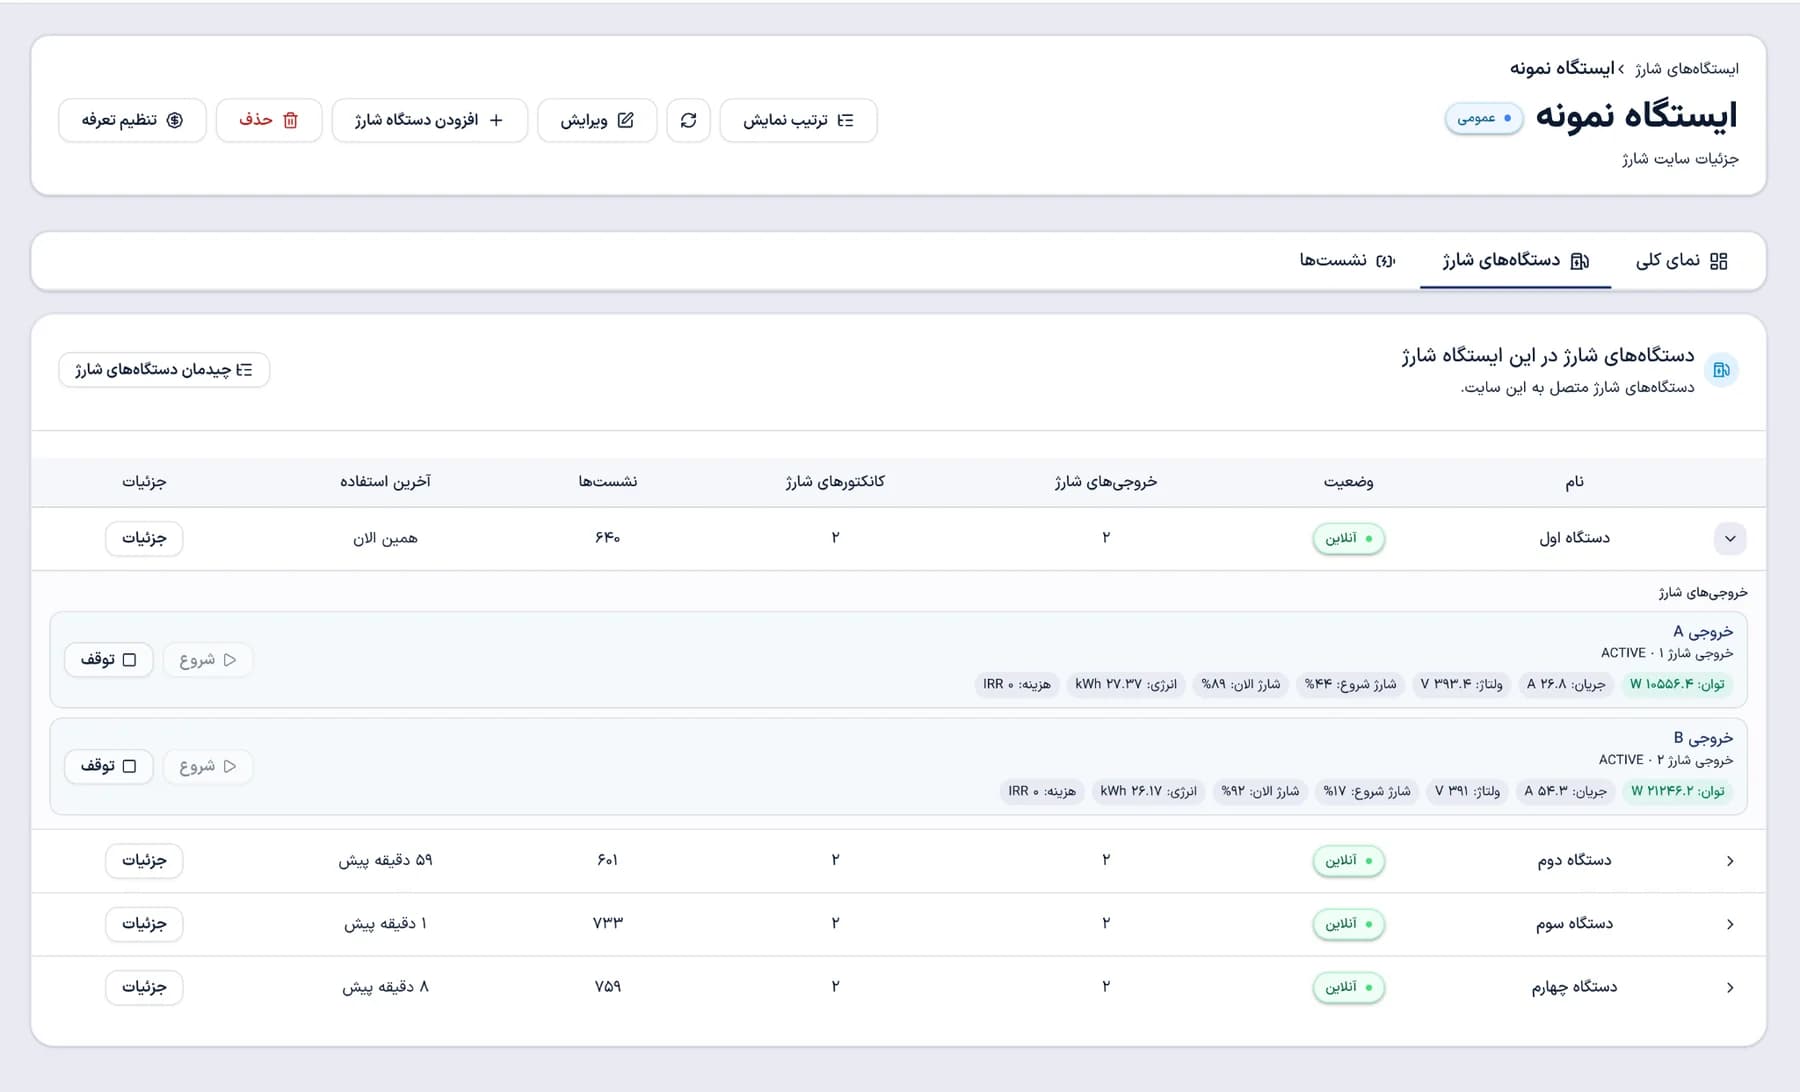
Is this device online? When did it last run?
Connectivity, connector counts, session counts, and last use for every device—side by side.
How much power is connector A delivering now?
For each charging connector: power, current, voltage, vehicle SoC since start, energy, and cost.
Can we stop charging from the panel?
From the station page, start or stop charging on any connector—without standing next to the device.
Which device charged when, and how much?
Every session records OCPP transaction ID, start and end, duration, energy, cost, and stop reason.
I need last month’s sessions for one city.
Filter sessions by organization, status, province, city, and date range—then export to Excel.
How is each session cost calculated?
Set a tariff per station; estimated cost for in-progress sessions appears beside each session.
Which stations can each team see?
Stations and sessions belong to organizations; each user enters the panel with a defined role, such as owner.
How do drivers find our station?
After review, a public station appears in the EV-YAR app and drivers start charging by scanning the device QR.
These areas are also in the Samasha menu and are introduced in the demo based on your network needs.
In the demo we focus on the areas that fit your devices and operating model.